Project Management
Design of Complex Integrated Circuits
12 Project Management
Project Management
- Tapeout is irreversible. Once the layout database is sent to the foundry, no change is possible until silicon returns, typically after two to four months of fabrication, packaging, and shipping. A bug found afterward costs a re-spin, i.e., new masks (see Section 7.2) and another full fabrication cycle.
Project Management
- Deadlines are fixed from the outside. Prototypes are often fabricated on a multi-project wafer (MPW) shuttle with a small number of fixed tapeout dates per year; missing a shuttle delays the project by months, not by days.
- Verification dominates. A large and growing fraction of the effort is not spent on designing but on verifying the design. Nevertheless, industry surveys show that only a minority of IC/ASIC projects achieve first-silicon success, and that most projects are behind schedule (Foster 2024).
Why IC Projects Are Special
- A project plan sets out how, who does what, and when
- better: also quality level, cost, and resources
- Tapeout is irreversible: a bug in silicon costs a re-spin (masks + months)
- Fixed deadlines: MPW shuttles have only a few tapeout dates per year
- Verification dominates the effort, still most projects are late and first-silicon success is rare
- Planning makes risk visible early and leaves time and budget to handle it
12.1 Goals and Constraints
Goals and Constraints
- Triple constraint: scope (incl. quality), time, cost—coupled, trade-offs must be explicit
- SMART goals: specific, measurable, achievable, relevant, time-bound
- bad: “design a low-power ADC”
- good: “10 bit SAR ADC, ENOB ≥ 9.5 bit at 1 MS/s, ≤ 100 µW, on the March SG13G2 shuttle”
- The specification is reviewed and frozen early
- Later changes via a formal change request (impact on schedule and cost)
12.2 Project Phases
Project Phases
| Phase | Main activities | Milestone (gate) |
|---|---|---|
| Definition | Requirements, feasibility, technology choice, budget | Specification and project plan frozen |
| Architecture | System modeling, block partitioning, block specifications, test and debug concept | Architecture review |
| Design | Schematic/RTL design, block simulation and verification | Design review |
| Layout | Floor plan, block layout, P&R, top-level assembly, PEX simulation | Layout review |
| Tapeout | DRC/LVS/ERC sign-off, final verification, database release | Tapeout |
| Fabrication | Test PCB, test program, lab setup (in parallel to the fab run) | Silicon arrival |
| Evaluation | Functional test, characterization, debug | Evaluation report |
| Qualification | Reliability tests, production test release (products only) | Release to production |
The V-Model
- Descending branch: decomposition (spec \(\rightarrow\) architecture \(\rightarrow\) blocks \(\rightarrow\) design and layout)
- Ascending branch: verification and integration (blocks \(\rightarrow\) chip \(\rightarrow\) silicon)
- Each level on the left defines the test criteria for the same level on the right
- The tip of the V (tapeout, fabrication) cannot be iterated quickly
- Every phase ends with a milestone = gate (review before the next phase)
- Agile iterations work well for RTL and software—but must converge before tapeout
12.3 Statement of Work
Statement of Work
- Introduction/background
- Technical description
- Timeline and milestones
- Payment details
- Client expectations
12.4 Work Breakdown Structure
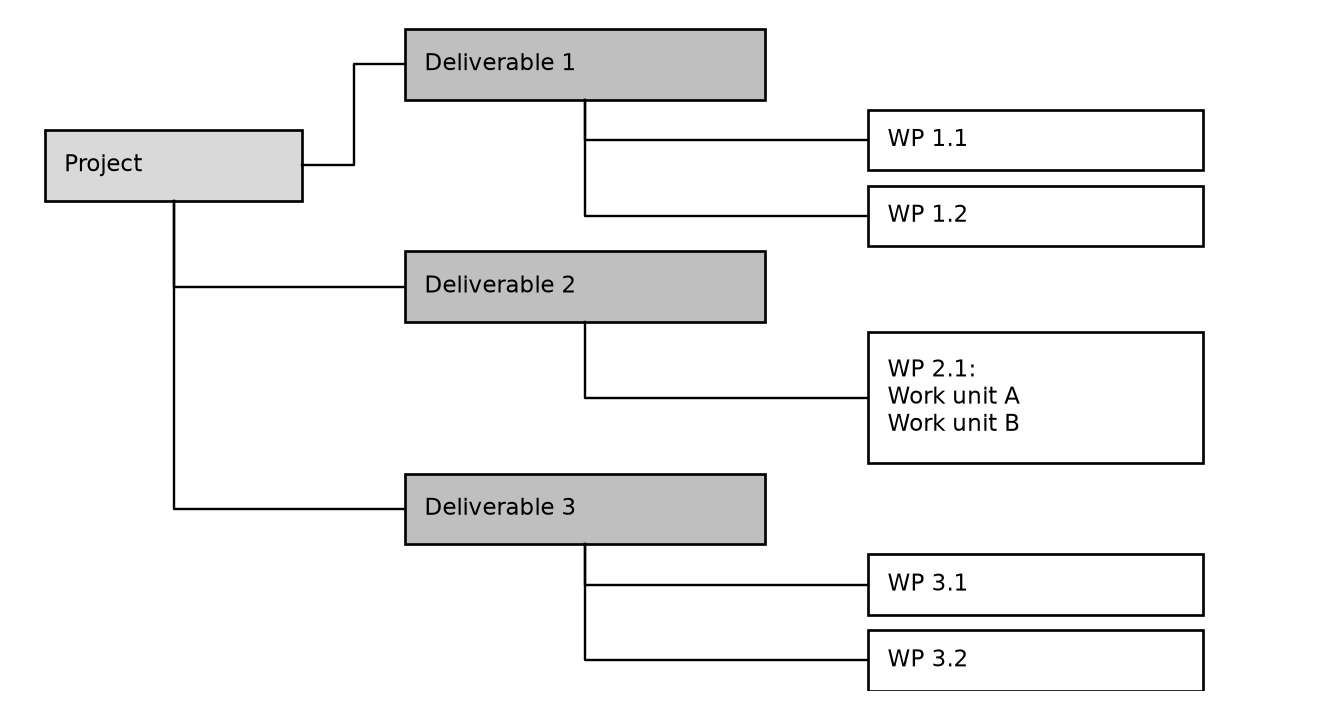
Work Breakdown Structure
Work Breakdown Structure
- 100 % rule: the WBS contains the complete work of the project—no more and no less—and the children of each element add up to 100 % of the parent’s work. Work that does not appear in the WBS will not be planned, staffed, or budgeted.
- Deliverable-oriented: the elements are outcomes (e.g., “bandgap reference, verified layout”), not activities or departments. This makes progress measurable.
- Mutually exclusive: no work is contained in two elements, otherwise it is counted twice.
Work Breakdown Structure
- Adequate granularity: a work package is small enough to be estimated and assigned to one responsible person, and large enough to be worth tracking; a common heuristic is a size between one day and a few weeks of effort.
Rules for a Good WBS
- 100 % rule: complete work of the project, children add up to the parent
- Deliverable-oriented: outcomes, not activities or departments
- Mutually exclusive: no work counted twice
- Granularity: estimable, one responsible person (≈ one day to a few weeks)
- WBS dictionary: owner, content, inputs, deliverables, effort, completion criterion
- Often forgotten in IC projects: top-level and mixed-signal verification, pad ring and ESD, package, test PCB and program, tapeout checks, documentation
12.5 Effort Estimation
Effort Estimation
\[ t_e = \frac{t_o + 4 t_m + t_p}{6}, \qquad \sigma_t = \frac{t_p - t_o}{6}. \tag{72}\]
Effort Estimation
- Brooks’s law (Brooks, Jr. 1995): “Adding manpower to a late software project makes it later.” New team members need training by the experienced ones, and the communication overhead grows with the number of pairs, \(n(n-1)/2\), in a team of \(n\) persons. The same holds for IC projects.
- Parkinson’s law: work expands to fill the time available. Generous buffers hidden in every task are consumed; it is better to estimate tasks realistically and to hold an explicit project buffer before the tapeout.
Effort Estimation
- Verification effort is regularly underestimated. It is not a phase at the end, but runs in parallel to the design from the first block on (see Section 11 and Section 10.2).
Effort Estimation
- Effort (person-days) \(\neq\) duration (calendar time); plan with 60–80 % availability
- Three-point estimate (PERT): optimistic, most likely, pessimistic
- Example: \(t_o = 5\), \(t_m = 8\), \(t_p = 17\) days \(\rightarrow\) \(t_e = 9\) days, \(\sigma_t = 2\) days
- Use historical data and bottom-up estimates by the people doing the work
- Brooks’s law: adding people to a late project makes it later (\(n(n-1)/2\) communication paths)
- Parkinson’s law: hidden buffers get consumed \(\rightarrow\) explicit project buffer
- Verification effort is regularly underestimated
12.6 Scheduling
Scheduling
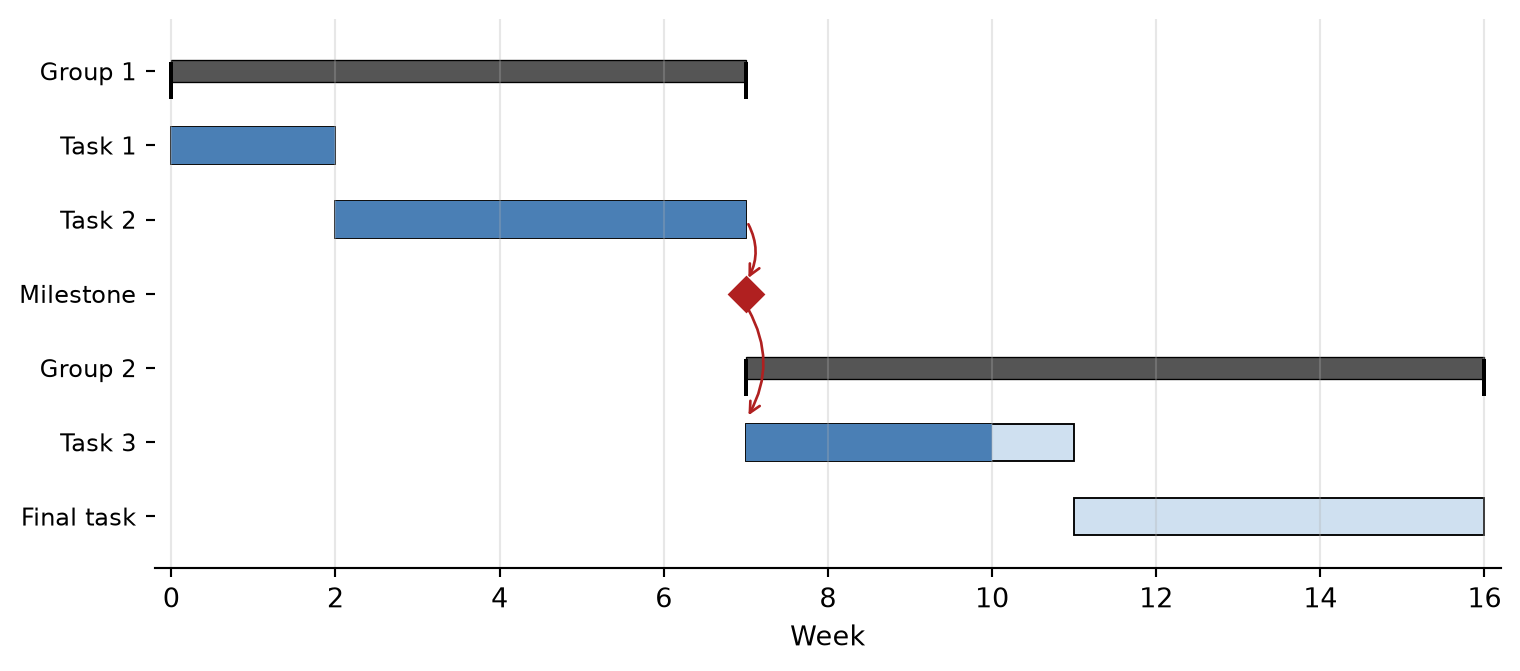
- Task names
- Start/finish dates or durations of the tasks
- Dependency relationships between the tasks
- Lag relationships (start-to-start, finish-to-start, etc.)
- Task responsibilities (who does it)
- Required resources
Scheduling
Scheduling
\[ \text{Float} = \text{LS} - \text{ES} = \text{LF} - \text{EF} \tag{73}\]
Scheduling
| Task | Description | Duration | Predecessors | ES | EF | LS | LF | Float |
|---|---|---|---|---|---|---|---|---|
| A | Specification and architecture | 2 | – | 0 | 2 | 0 | 2 | 0 |
| B | Analog design | 6 | A | 2 | 8 | 2 | 8 | 0 |
| C | Digital RTL design and verification | 4 | A | 2 | 6 | 6 | 10 | 4 |
| D | Analog layout | 4 | B | 8 | 12 | 8 | 12 | 0 |
| E | Digital synthesis and P&R | 2 | C | 6 | 8 | 10 | 12 | 4 |
| F | Top-level integration and verification | 3 | D, E | 12 | 15 | 12 | 15 | 0 |
| G | Sign-off and tapeout | 1 | F | 15 | 16 | 15 | 16 | 0 |
Critical Path Method
- Forward pass: earliest start/finish (ES, EF = ES + duration)
- Backward pass: latest finish/start (LF, LS = LF − duration)
- Tasks with zero float form the critical path; delay there = delay of the tapeout
- Example: analog design and layout are critical, digital branch has 4 weeks float
- Backward scheduling from the shuttle date: negative float \(\rightarrow\) plan infeasible
- The critical path can move; CPM assumes unlimited resources
12.7 Roles and Responsibilities
Roles and Responsibilities
| Work package | Project lead | Analog designer | Digital designer | Layout | Test engineer |
|---|---|---|---|---|---|
| Chip specification | A | R | R | C | C |
| Bandgap reference | I | A/R | – | C | C |
| Digital control (RTL) | I | C | A/R | – | C |
| Top-level layout | I | C | C | A/R | I |
| Tapeout sign-off | A | R | R | R | I |
| Test program | I | C | C | – | A/R |
12.8 Risk Management
Risk Management
| Risk | \(P\) | \(I\) | \(P \cdot I\) | Response |
|---|---|---|---|---|
| Functional bug found after tapeout | 3 | 5 | 15 | Mitigate: verification plan with coverage metrics, reviews, spare cells and metal-fix options (see Section 10.5) |
| Late or immature PDK or IP | 3 | 4 | 12 | Mitigate: early test chip, qualified IP only, freeze PDK version |
| Key designer leaves or is unavailable | 2 | 5 | 10 | Mitigate: reviews, documentation, second person per critical block |
Risk Management
| Risk | \(P\) | \(I\) | \(P \cdot I\) | Response |
|---|---|---|---|---|
| Performance missed due to layout parasitics | 3 | 3 | 9 | Mitigate: parasitic estimates in early simulations, PEX simulations (see Section 10.3) |
| Shuttle date missed | 2 | 4 | 8 | Avoid: backward scheduling with buffer; accept: identify alternative shuttle |
| Specification change by customer | 2 | 3 | 6 | Mitigate: specification freeze and change-request process |
Risk Management
- Loop: identify, assess, plan response, monitor
- Risk register: probability \(P\) × impact \(I\) \(\rightarrow\) priority
- Responses: avoid, mitigate, transfer, accept (with contingency)
- Biggest IC risk: non-functional first silicon
- verification plan with coverage, independent reviews, tapeout checklist
- test chips for new concepts, observability and programmability
- schedule and budget contain a realistic metal re-spin
12.9 Reviews and Tapeout Checklist
Reviews and Tapeout Checklist
- DRC, LVS, ERC, antenna, and density checks clean on the final database, all waivers documented and approved by the foundry (see Section 4.7)
- Post-layout (PEX) simulations of all critical blocks over corners and temperature (see Section 10.2)
- ESD and latch-up checks, pad ring and bonding diagram matched to the package (see Section 9 and Section 5)
- Seal ring, chip ID/revision marking, alignment and test structures present
Reviews and Tapeout Checklist
- Top-level netlist and layout versions tagged in the version control system; the final GDSII checksum recorded
- Test concept and test PCB ready to start in parallel to the fabrication (see Section 6.4)
Design Reviews and Tapeout Checklist
- Design reviews at every gate: cheapest way to find errors
- documents in advance, independent reviewers, written action items (owner, due date)
- “what if” questions: power-up, unsettled references, illegal states
- Tapeout checklist (grows with every project):
- DRC/LVS/ERC/antenna/density clean, waivers approved
- PEX simulations over corners and temperature
- ESD/latch-up, pad ring, bonding diagram
- seal ring, chip ID, test structures
- versions tagged, GDSII checksum recorded
- test PCB and program started
12.10 Tracking and Control
Tracking and Control
\[ \text{SPI} = \frac{\text{EV}}{\text{PV}}, \qquad \text{CPI} = \frac{\text{EV}}{\text{AC}} \tag{74}\]
Tracking and Control
- Weekly status: work packages, action items, top risks
- Measure progress by completed deliverables, not by time spent
- Earned value: SPI = EV/PV (schedule), CPI = EV/AC (cost)
- example: PV = 40, EV = 32, AC = 45 person-weeks \(\rightarrow\) SPI = 0.8, CPI ≈ 0.71
- Milestone trend analysis: rising line = slipping milestone (early warning)
- Version control, issue tracker, automated regressions
- Lessons learned update estimates and the tapeout checklist
12.11 Team and Communication
Team and Communication
- Conway’s law: system structure mirrors the communication structure
- block interfaces = team interfaces (analog, digital, layout, test) \(\rightarrow\) likely bugs
- write down, own, and review interface specifications
- Design work needs uninterrupted concentration; context switches are expensive
- Protect the team, resolve blockers quickly, communicate bad news early
References
Brooks, Jr., Frederick P. 1995. The Mythical Man-Month: Essays on Software Engineering. Anniversary. Addison-Wesley.
Conway, Melvin E. 1968. “How Do Committees Invent?” Datamation 14 (4): 28–31.
DeMarco, Tom, and Timothy Lister. 2013. Peopleware: Productive Projects and Teams. 3rd ed. Addison-Wesley.
Doran, George T. 1981. “There’s a S.M.A.R.T. Way to Write Management’s Goals and Objectives.” Management Review 70 (11): 35–36.
Forsberg, Kevin, and Harold Mooz. 1991. “The Relationship of System Engineering to the Project Cycle.” Proceedings of the First Annual Symposium of the National Council on Systems Engineering (NCOSE), 57–65. https://doi.org/10.1002/j.2334-5837.1991.tb01484.x.
Foster, Harry D. 2024. 2024 Siemens EDA and Wilson Research Group IC/ASIC Functional Verification Trend Report. White Paper. Siemens Digital Industries Software.
Kelley, Jr., James E., and Morgan R. Walker. 1959. “Critical-Path Planning and Scheduling.” Proceedings of the Eastern Joint IRE-AIEE-ACM Computer Conference, 160–73. https://doi.org/10.1145/1460299.1460318.
Kerzner, Harold. 2022. Project Management: A Systems Approach to Planning, Scheduling, and Controlling. 13th ed. Wiley.
Malcolm, D. G., J. H. Roseboom, C. E. Clark, and W. Fazar. 1959. “Application of a Technique for Research and Development Program Evaluation.” Operations Research 7 (5): 646–69. https://doi.org/10.1287/opre.7.5.646.
Project Management Institute. 2019. Practice Standard for Work Breakdown Structures. 3rd ed. Project Management Institute.
Project Management Institute. 2021. A Guide to the Project Management Body of Knowledge (PMBOK Guide) and the Standard for Project Management. 7th ed. Project Management Institute.